A network dashboard should make the information a person needs easy to find. An engineer investigating a fault needs detail, while a manager may need a clear view of service health and business impact. Designing views around those different tasks helps each audience use the data.
That is where role-based dashboard design becomes a strategic choice rather than a cosmetic one. With Lumics, teams can build separate views for different operational needs without fragmenting the underlying data model. The goal is not to hide information. It is to present the right information in the right frame, so decisions happen faster and with less noise. A well-designed network monitoring dashboard does not just report conditions. It helps each audience understand what those conditions mean.
Why One Dashboard View Usually Fails Three Different Audiences
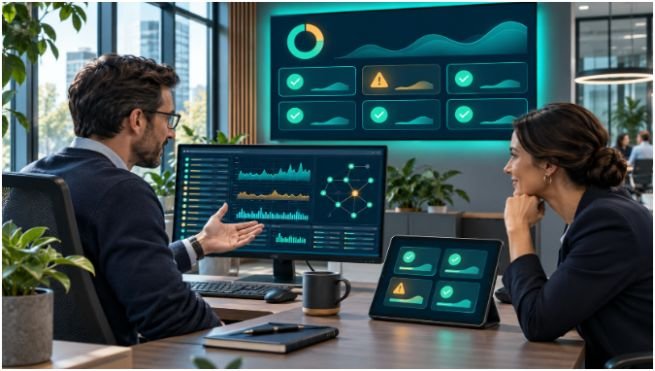
A common mistake is assuming that “more visibility” automatically improves operations. Visibility without role context can create confusion. An executive dashboard that shows device-level chatter will bury the business narrative. A specialist dashboard stripped down to summaries will slow root-cause work. A customer-facing view overloaded with operational detail may create more concern than confidence.
The issue is not data availability. It is relevance. The same incident can be framed in three valid ways:
- An executive needs to know whether services are stable and whether the issue affects users or commitments.
- A specialist needs to know where the spike started, how it moved, and which subsystem changed first.
- A customer needs to know whether the problem is being handled and whether service status is improving.
When teams force one layout to do all three jobs, they usually compensate with filters, tabs, and layered drill-downs. That adds friction. In a fast-moving environment, friction becomes delay. Lumics is built around the opposite idea: separate the operational lens from the underlying telemetry, then let each role move through the data at the level they need.
What Each Role Actually Needs From a Dashboard

The most useful dashboard is not defined by aesthetics first. It is defined by decision velocity. Each role has a different threshold for detail, and that should shape both layout and widget selection.
Executive Dashboards Should Translate Events Into Impact
An executive view should be concise, stable, and business-aware. It should answer questions such as: Is the environment healthy? Is there a material outage or degradation? Is the trend getting better or worse?
That means emphasizing status patterns, high-level service health, and a small number of carefully chosen indicators. A good executive dashboard avoids overloading the viewer with the mechanics of the incident. It should support quick interpretation, not forensic analysis. In Lumics, this kind of dashboard can be kept intentionally simple while still linking back to the deeper operational context when needed.
Specialist Dashboards Should Accelerate Diagnosis
Specialists need the opposite balance. They need density, precision, and interaction. A specialist dashboard should surface the relevant devices, interfaces, metrics, and histories in one place, so the operator can move from symptom to source without switching tools.
This is where Lumics is especially practical. Its customizable widgets, synchronized timeframes, and min/max graphing are designed for hands-on troubleshooting. If one metric spikes, the operator should be able to zoom into that interval and see every related widget align to the same window. That turns a loose collection of graphs into a coherent investigation surface.
Customer Dashboards Should Build Confidence Without Oversharing
Customer dashboards are often misunderstood. They are not mini versions of internal operations screens. Their job is to provide clarity, trust, and status continuity. The right customer view shows what is relevant to the service experience, not every internal metric that happened to move.
A customer-facing dashboard should be current, readable, and restrained. If it is too sparse, it feels evasive. If it is too detailed, it creates unnecessary concern. The best version gives a reliable picture of service health while remaining easy to understand at a glance. Lumics supports this separation cleanly, which matters when internal teams and external audiences need different versions of the same operational truth.
The Design Choices That Make Role-Based Views Work
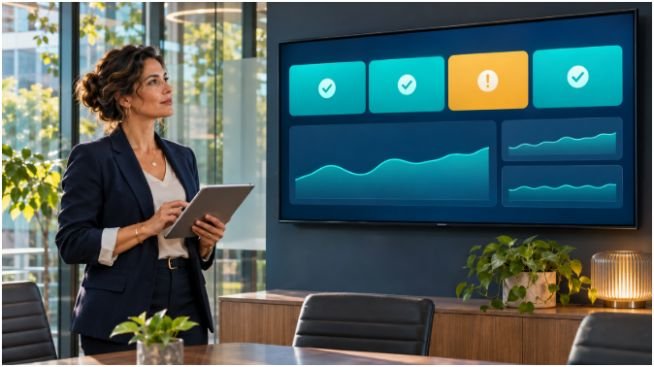
Role-based dashboards fail when they are treated as templates instead of operating tools. Much like the UX standards used by leading software developers, good design choices reduce cognitive load, preserve accuracy, and make the system easier to maintain as the environment grows.
Time Synchronization Turns Separate Widgets Into One Investigation Surface
One of the most valuable dashboard behaviors is synchronized timeframe control. If an operator zooms into a five-minute spike on one graph, the rest of the widgets should align to that same interval. Otherwise, the viewer is forced to mentally reconcile mismatched windows and can miss the relationship between cause and effect.
Lumics’ time-synced widgets are useful because they reduce this reconciliation burden. Instead of opening multiple views or manually lining up timestamps, the operator can stay inside one dashboard and inspect the same moment across several signals. That is a small interface detail with a large operational effect.
Min and Max Matter More Than Average in Incident Work
Averages are often too smooth to be useful during incidents. They can hide sharp spikes, short-lived saturation, or intermittent drops that matter more than the overall trend. That is why min/max graphing is more operationally honest than average-only views.
In a specialist dashboard, the difference is decisive. A stable average may suggest everything is fine while a max value shows that a link or service is repeatedly crossing a dangerous threshold. Lumics highlights those real excursions, helping teams spot what changed instead of what merely stayed roughly normal.
Full-Data Views Beat Arbitrary Cutoffs
A dashboard should not hide relevant devices behind an arbitrary Top 10 list if the eleventh device is the one causing the problem. Ranking can be useful, but it should not replace access. Operators need real search, filtering, and the ability to see the full operational picture when necessary.
This is one of the quieter strengths of Lumics. The platform is built to surface the data points that matter, not just the top entries that fit on the screen. That matters in environments where the important clue is often outside the default ranking.
How Lumics Supports Faster Operational Collaboration
Operational dashboard design is not just a viewing exercise; it is a collaboration model that underpins high-performing operations. When teams can create, copy, customize, and share unlimited dashboards, they can standardize what matters without locking everyone into the same layout.
That flexibility changes the workflow in practical ways. A senior engineer can preserve a troubleshooting view for a recurring issue. A manager can keep an executive view that remains stable week to week. A support team can share a customer-facing view that reduces back-and-forth during an incident. The dashboard becomes a reusable operational asset, not a personal scratchpad.
Lumics also supports a useful division between private work and shared context. An operator can build a personal version of a dashboard, test a layout, and then share it once it proves useful. That is a better model than forcing every team member to edit a single canonical screen. It encourages experimentation without sacrificing consistency.
The platform’s local collector caching also matters here. If connectivity to the cloud drops, data collection continues locally and syncs after the connection is restored. For dashboard design, that means the view is built around continuity rather than fragility. Teams are not forced to abandon the operational record just because a network path was interrupted.
Designing for the Moment of Action, Not the Moment of Reporting
The most effective dashboard is the one that supports the next decision, not the next meeting. That principle should shape every layout choice.
Strong operators ask a few disciplined questions:
- What does this role need to know in under ten seconds?
- What detail should appear only after a zoom or filter action?
- Which widgets should stay fixed so comparisons remain meaningful?
- What information is essential for escalation, and what is just noise?
- How much context is enough for the current audience without overwhelming them?
Those questions lead to cleaner dashboards and fewer false starts during incidents. They also make ongoing maintenance easier because the design has a purpose beyond looking complete. A dashboard that is built for action stays useful longer than one built to impress in a demo.
Teams using Lumics can organize dashboards around the tasks each audience needs to complete. It gives engineers room to build role-specific views while keeping the underlying telemetry aligned and accessible. That is the difference between a screen that reports and a tool that helps.
The long-term lesson is simple: dashboard design should follow the work, not the other way around. If each role gets a view tailored to its decisions, the network becomes easier to understand, easier to explain, and faster to manage.